Generate monthly chart data with Eloquent & Carbon
Geni Jaho
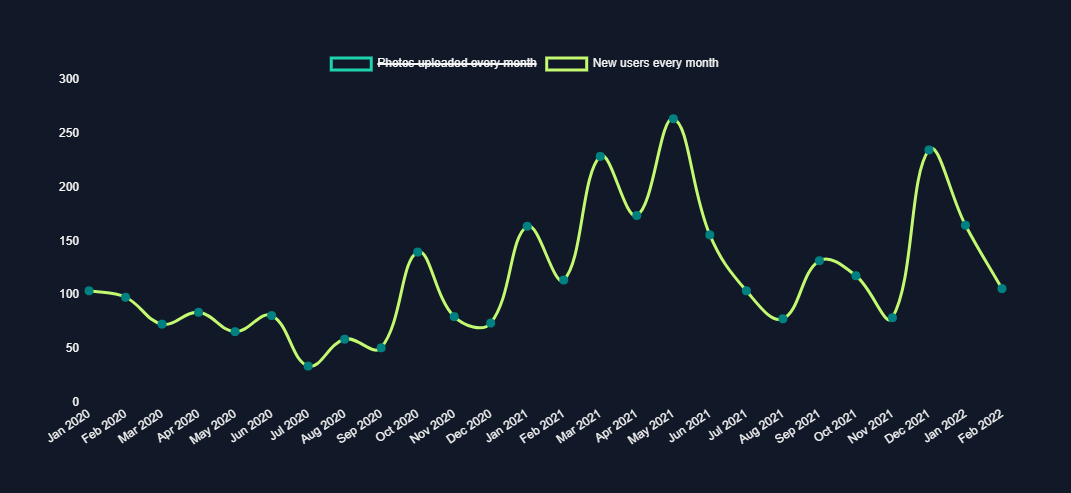
5 min readSay we want to display the number of users that signed up in the last years, for each month. It's not that hard to achieve but there are two little gotchas that become annoying once you begin to develop this. Q1: how do we account for months that have no data? and Q2: how performant can it get?
The initial approach
We won't go into all the details of how to create the chart above on the JS side of things, but the gist is that we've used the Chart.js library and its wrapper in Vue (styling in the bottom of the post). That said, we need to provide the front-end with two pieces of data: the labels and the totals for each label.
For the totals, this is the query that groups the data by each month.
Essentially, what this selection date_format(created_at, '%b %Y') does is that it maps the created_at field into a string containing the field's month and year, like 'Mar 2022'. Down below the query builder, we group by this value and count the users for each group. Since the chart will need to be provided with labels and totals separately, we just pluck them from the query results.
Q1: Some months are missing though
The thing is that MySql will group your rows by month and year, but there might be some gaps depending on how distributed your data is. If there's no data for a given month, it simply won't be in the results. Bummer! The chart will just accept the data as-is and become skewed, leaving you with a misleading visual representation.
After praying to the developer gods of wisdom you finally google the problem and come up with a solution. We'll manually create the date periods we need for the chart, and map the query results to each period. Sweet.
To create the time periods in Laravel the CarbonPeriod class is quite handy in these cases.
Lots to digest here. Firstly, notice the ->keyBy('period') we appended to the query results. We do that so we can access the results directly by the time period.
To generate the periods, the CarbonPeriod::create() method accepts three parameters: the start date, the period length in a human-readable form, and the end date. We're omitting the last month since we don't want to show incomplete last-month data. The resulting object can be iterated and on each iteration, we get a CarbonInterface to work on.
We do another round on the newly generated list of period strings to map them to the totals. If we can't find a value for a given period, we apply our long-lost 0.
Q2: Performance you said?
Hate to accept it but using a group by in a date_format selection is not the best idea in the MySql world. It will not use any indexes you have on the created_at field. Horrible! Anyway, look at your use case. If you don't have many rows, and you don't need to run this query too often, say, once a month, stick to this implementation. Keep it stupidly simple. You can always cache the results, like this:
Another way around this is to add another column in your table to store the month-year value of each row, with an index, and then you can just group on it directly. Would be way faster, but it would decrease maintainability a bit. You could also store the grouped results in a separate table completely, and refresh it once a month. Or use Elasticsearch, lol.
Styling that graph nicely
Using the LineChart example here, these are the main parts of styling we've used:
Long post, I know. Thanks for making it here. See you in the next one.
The code used for illustration is taken from the OpenLitterMap project. They're doing a great job creating the world's most advanced open database on litter, brands & plastic pollution. The project is open-sourced and would love your contributions, both as users and developers.
